
![]() istorical
grain yields provide us with a glimpse of yields yet to come, although, like
the stock markets, past performance is no guarantee of the future. State average
corn grain yield in Indiana has increased approximately 1.6 bushels per acre
per year since 1930, primarily due to improved genetics and production technology
(Fig. 1).
istorical
grain yields provide us with a glimpse of yields yet to come, although, like
the stock markets, past performance is no guarantee of the future. State average
corn grain yield in Indiana has increased approximately 1.6 bushels per acre
per year since 1930, primarily due to improved genetics and production technology
(Fig. 1).
The final USDA estimate for 2004 puts the Indiana corn crop at 168 bushels per acre, or about 16 percent above the 2004 trend line yield of 144.8 bushels per acre (Fig 1). November 2004 corn production estimates for each crop reporting district in Indiana are available in text or graphical formats.
Factors that contributed to the record high statewide corn yield included reasonably early planting of the crop, generally excellent stand establishment conditions resulting in higher than normal plant populations & ear counts per acre, minimal stress prior to pollination that resulted in excellent ear size determination, minimal stress during pollination that resulted in excellent kernel set, minimal stress during the grain filling period that resulted in high kernel weights, and generally great weather for corn harvest.
Over the past ten years, Indiana's corn crop has finished an equal number of times above and below the trend line (Fig. 1). Recent years' departures from trend yield (Fig. 2) were +2.0% (2003), -14.5% (2002), +11.5% (2001), +6.3% (2000), and -3.4% (1999). For the 2005 crop season, trend line yield for corn would be 146.4 bushels per acre. Only time will tell whether the actual crop finishes above or below that trend yield.
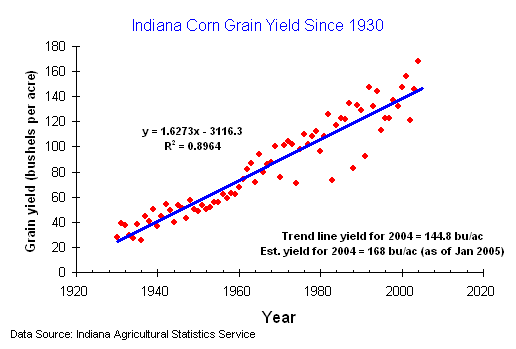
Fig. 1
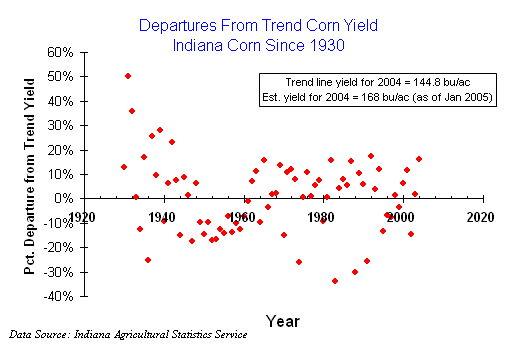
Fig. 2
Annual grain yield values fluctuate above and below the trend line throughout the more than 70 year period of records, but four disaster years are especially noteworthy. Late planting plus early fall frosts in 1974 resulted in state average corn yields 26% less than the trend value. Severe droughts in 1983, 1988 and 1991 resulted in yields 34%, 30% and 26% less than trend values.
Because the departures from trend for these four years are so dramatic, it is of some interest to calculate the trend line for corn grain yield without their inclusion. In so doing, the annual rate of yield increase is slightly greater (1.7 versus 1.63 bu/ac/yr) and the estimated trend yield for 2004 changes from 144.8 to 149.3 bushels per acre (Fig. 3). Similarly, trend yield for 2005 would increase to 151.0 bushels per acre. Such values may be more true estimates of statewide yield potential in "normal" years.
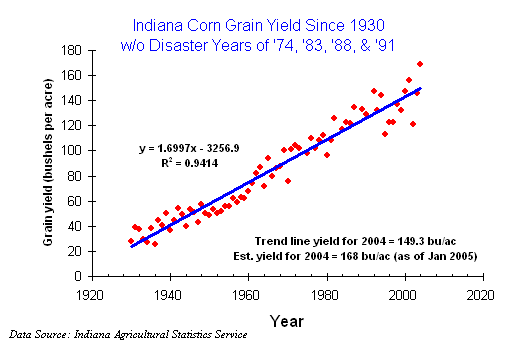
Fig. 3
The top five U.S. corn grain producing states are Iowa, Illinois, Nebraska, Minnesota and Indiana (Fig. 4). According to the final USDA production estimates for 2003, these five states (7.7 billion bushels) accounted for just over 65 % of the total estimated grain yield for the U.S. in 2004 (11.8 billion bushels).
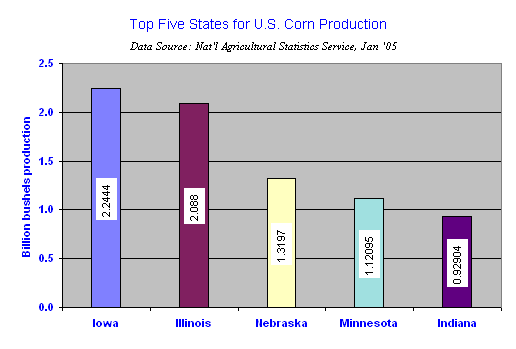
Fig. 4
Historically, bragging rights for highest U.S. corn yields per acre typically belong to states farther to the west and southwest (e.g., Arizona, Washington, California). Corn growing regions of these states usually have a) fewer cloudy and hazy days, b) less rainfall and humidity contributing to less disease, c) availability of irrigation, and d) fewer stressful hot nights during grainfill than states in the U.S. Corn Belt. In 2004, however, record high yields in the Corn Belt rivaled those in the west/southwest due to exceptional weather and minimal pest pressure (Fig. 5).
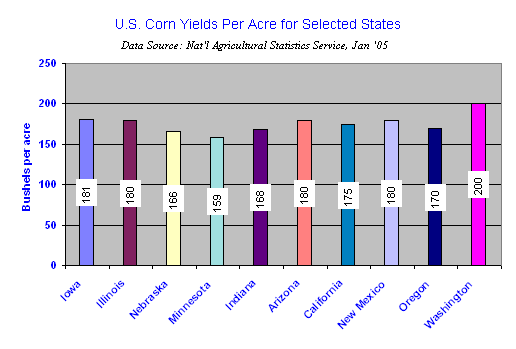
Fig. 5
USDA-NASS. 2004. Crop Production 2004 Summary. Available online at http://usda.mannlib.cornell.edu/reports/nassr/field/pcp-bban/cropan05.pdf (URL verified 1/12/05).
USDA-NASS. 2004. Indiana District Corn Yields. Indiana Agricultural Statistics Service. Available online at http://www.nass.usda.gov/in/charts/04crnyld.gif (URL verified 1/12/05).
USDA-NASS. 2004. Indiana District Estimates November 2004. Indiana Agricultural Statistics Service. Available online at http://www.nass.usda.gov/in/pressrel/de111204.txt (URL verified 1/12/05).